
The plugin has a tab for each saved monitor.
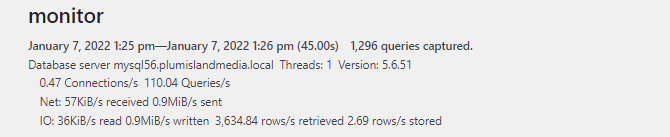
It shows database server’s hostname and version, and some metrics of your database server’s overall activity rates during the capture of the monitor. It shows activity on behalf of all users of your database server. So if you share your the server with other WordPress sites or other web applications, their activity is shown as well as your site’s activity.
- Threads is the number of active queries running, on behalf of all users of the database system, at the end of the capture.
- Connections/s is the number of database connections per second. This section also shows failed connections if there were any. (Failed connections can be caused by overburdened database servers.)
- Queries/s is the number of queries per second, on behalf of all users.
- Net received is the data traffic per second received from WordPress and other users of the database server. sent is the data traffic sent by the database server to WordPress and other users. (Notice this is not the data received from your site’s users or sent to them. It is the database traffic, not your site traffic.)
- IO read is the data your database server retrieved from its hard drives (or SSDs) per second.
- IO written is the data your database server sent to its drives per second.
- rows retrieved is the number of rows — data items in tables — per second your database retrieved from its drives. This number is reduced, or sometimes increased, by internal caching in the database server.
- rows stored is the number of rows per second inserted, updated, or deleted per second by your database server during the monitor.
Some database server versions have other metrics to show.


And, you can search for captured queries. For example, to search for queries using the wp_postmeta table, type its name into the search box.

SELECT option_value FROM wp_options WHERE option_name = 'something' LIMIT 1
This query was, during the capture of this monitor, run 624 times to display various pages on the dashboard. WordPress didn’t use it to retrieve exactly the same value over and over, of course. The 'somevalue' in the query varied from use to use, but the pattern was the same.
In the first row of the example we learn these facts about that query pattern.
- The 624 queries (Count) took a Total of 438 milliseconds to run.
- Each of those queries took, on average (Mean), 703 microseconds to run
- The amount of time they took varied (Spread) by plus or minus 178 microseconds. This column shows the mean absolute deviation (also known as average absolute deviation) of the time the queries took.
- The 95th percentile (P95) of queries took 1,141 microseconds (1.14 milliseconds). That is, 95% of the queries took less time than that. This metric is useful for uncovering situations where most queries are fast, but some are slow.
Click on the table’s columns headers to sort by the values in that column. Click again to sort them in the opposite order. To sort by one column then another, click on the first column and shift-click on the second column.
(Thanks to Allan Jardine for his excellent Datatables technology for making this table display possible.)